Every order, patient, and dollar,
ready to query.

Your data is trapped in systems that don’t talk to each other
Pharmacy data lives in one system, clinician activity in another, and patient outcomes in a third. When someone asks for the average time-to-fill or which providers are most efficient, the answer takes days of spreadsheet work, if it comes at all.
Data & Intel gives you developer-level access to every operational metric across your medical workflows.
See which ads become patients
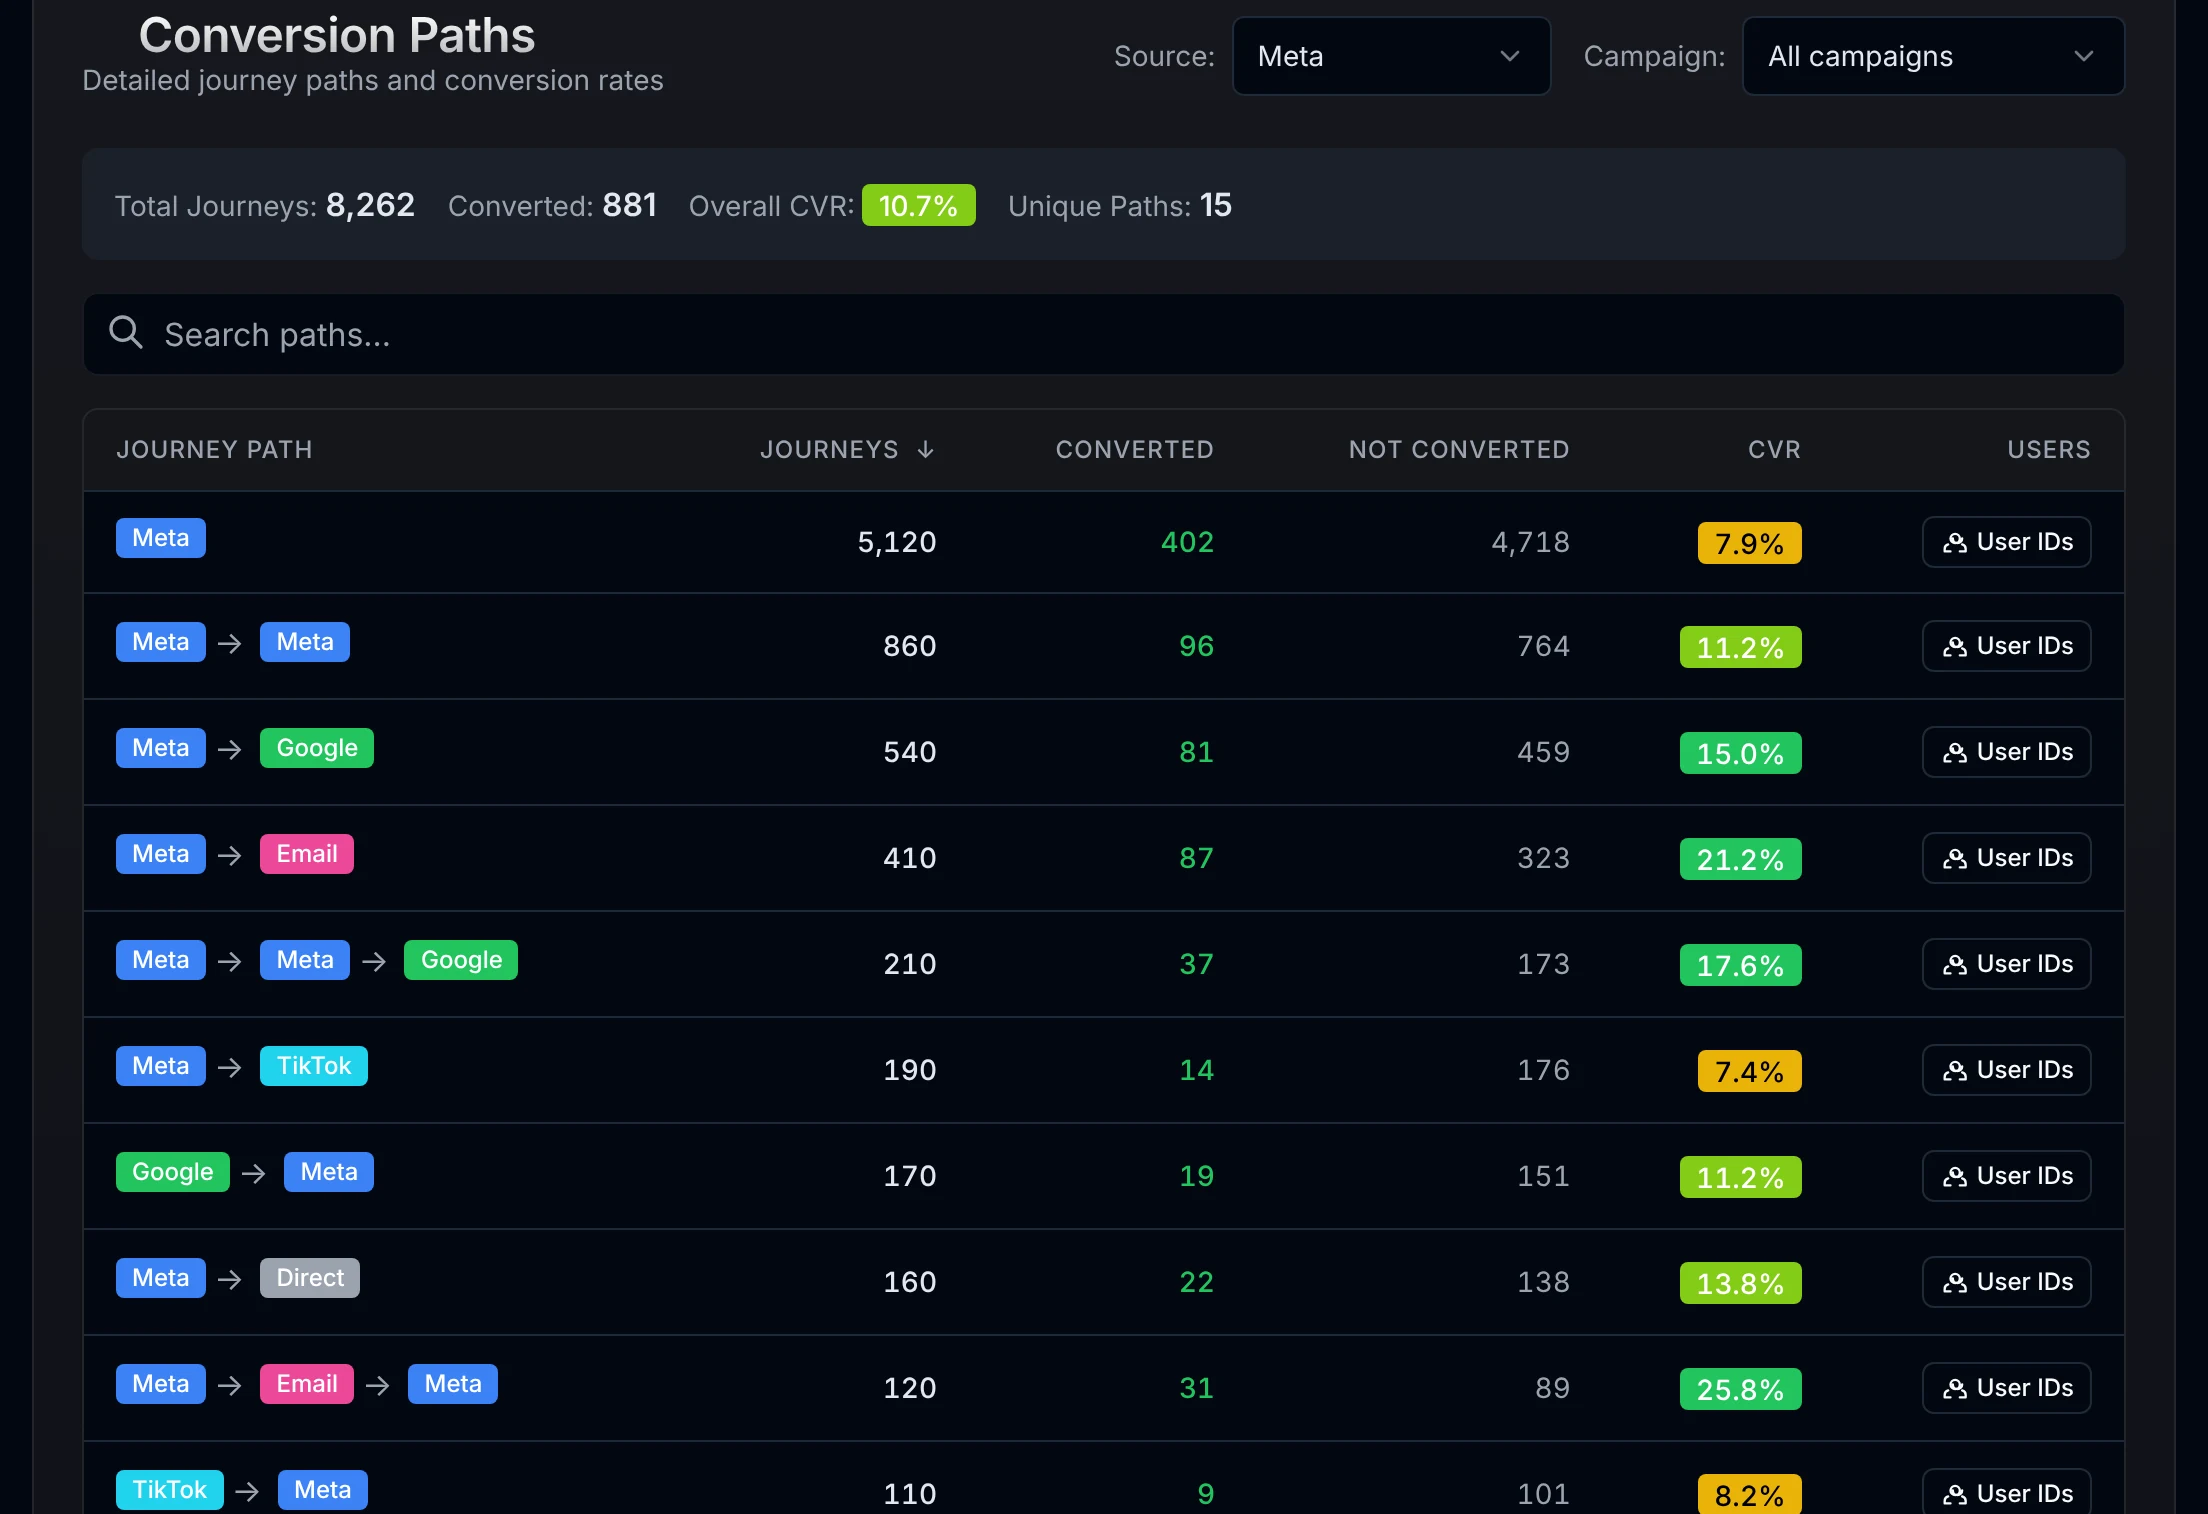
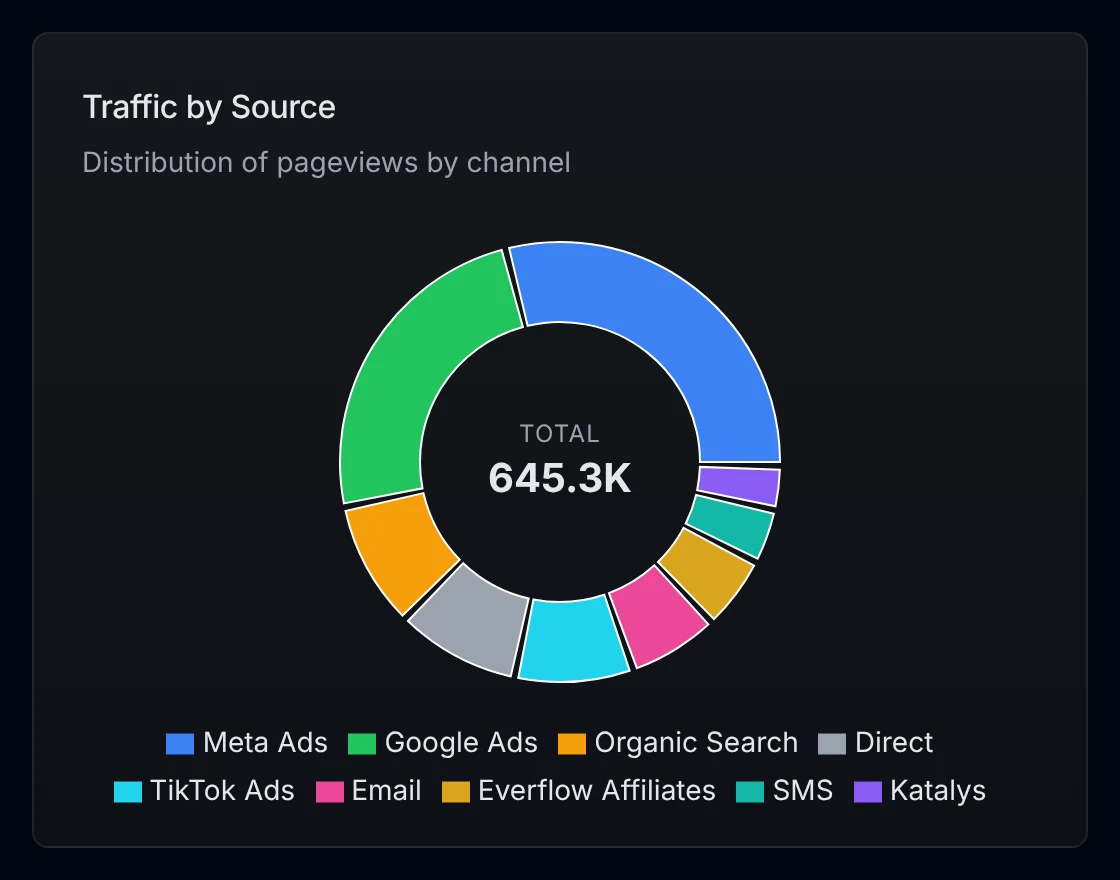
Marketing, intake, prescribing, and payments share one database, so every patient journey is traced from the first click to the prescription they filled. You see which paths convert, which channels pay off, and what each patient costs to acquire.

Put every ad dollar next to the revenue it brought in
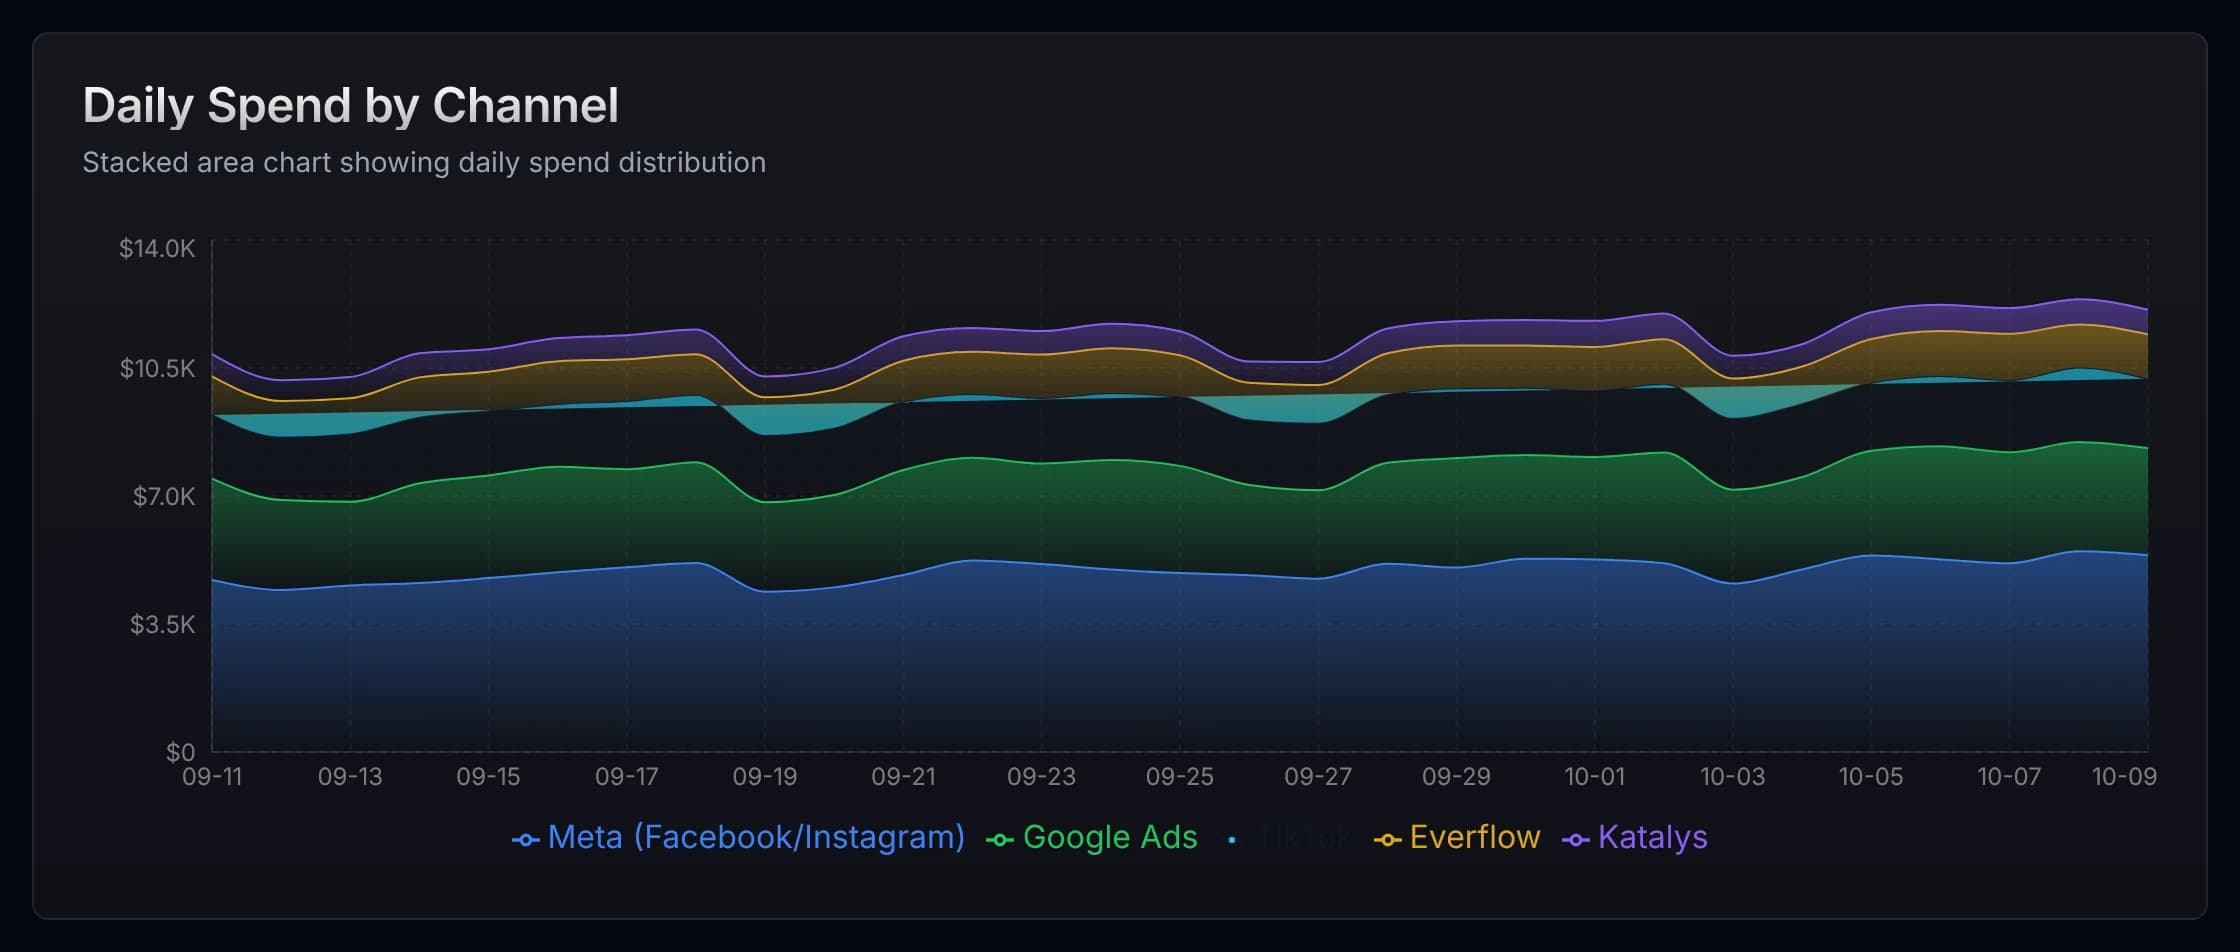
Daily spend by channel sits beside conversion and revenue, so a campaign is judged on the patients it produced. Your acquisition cost is measured against cleared revenue, not an ad platform’s estimate.
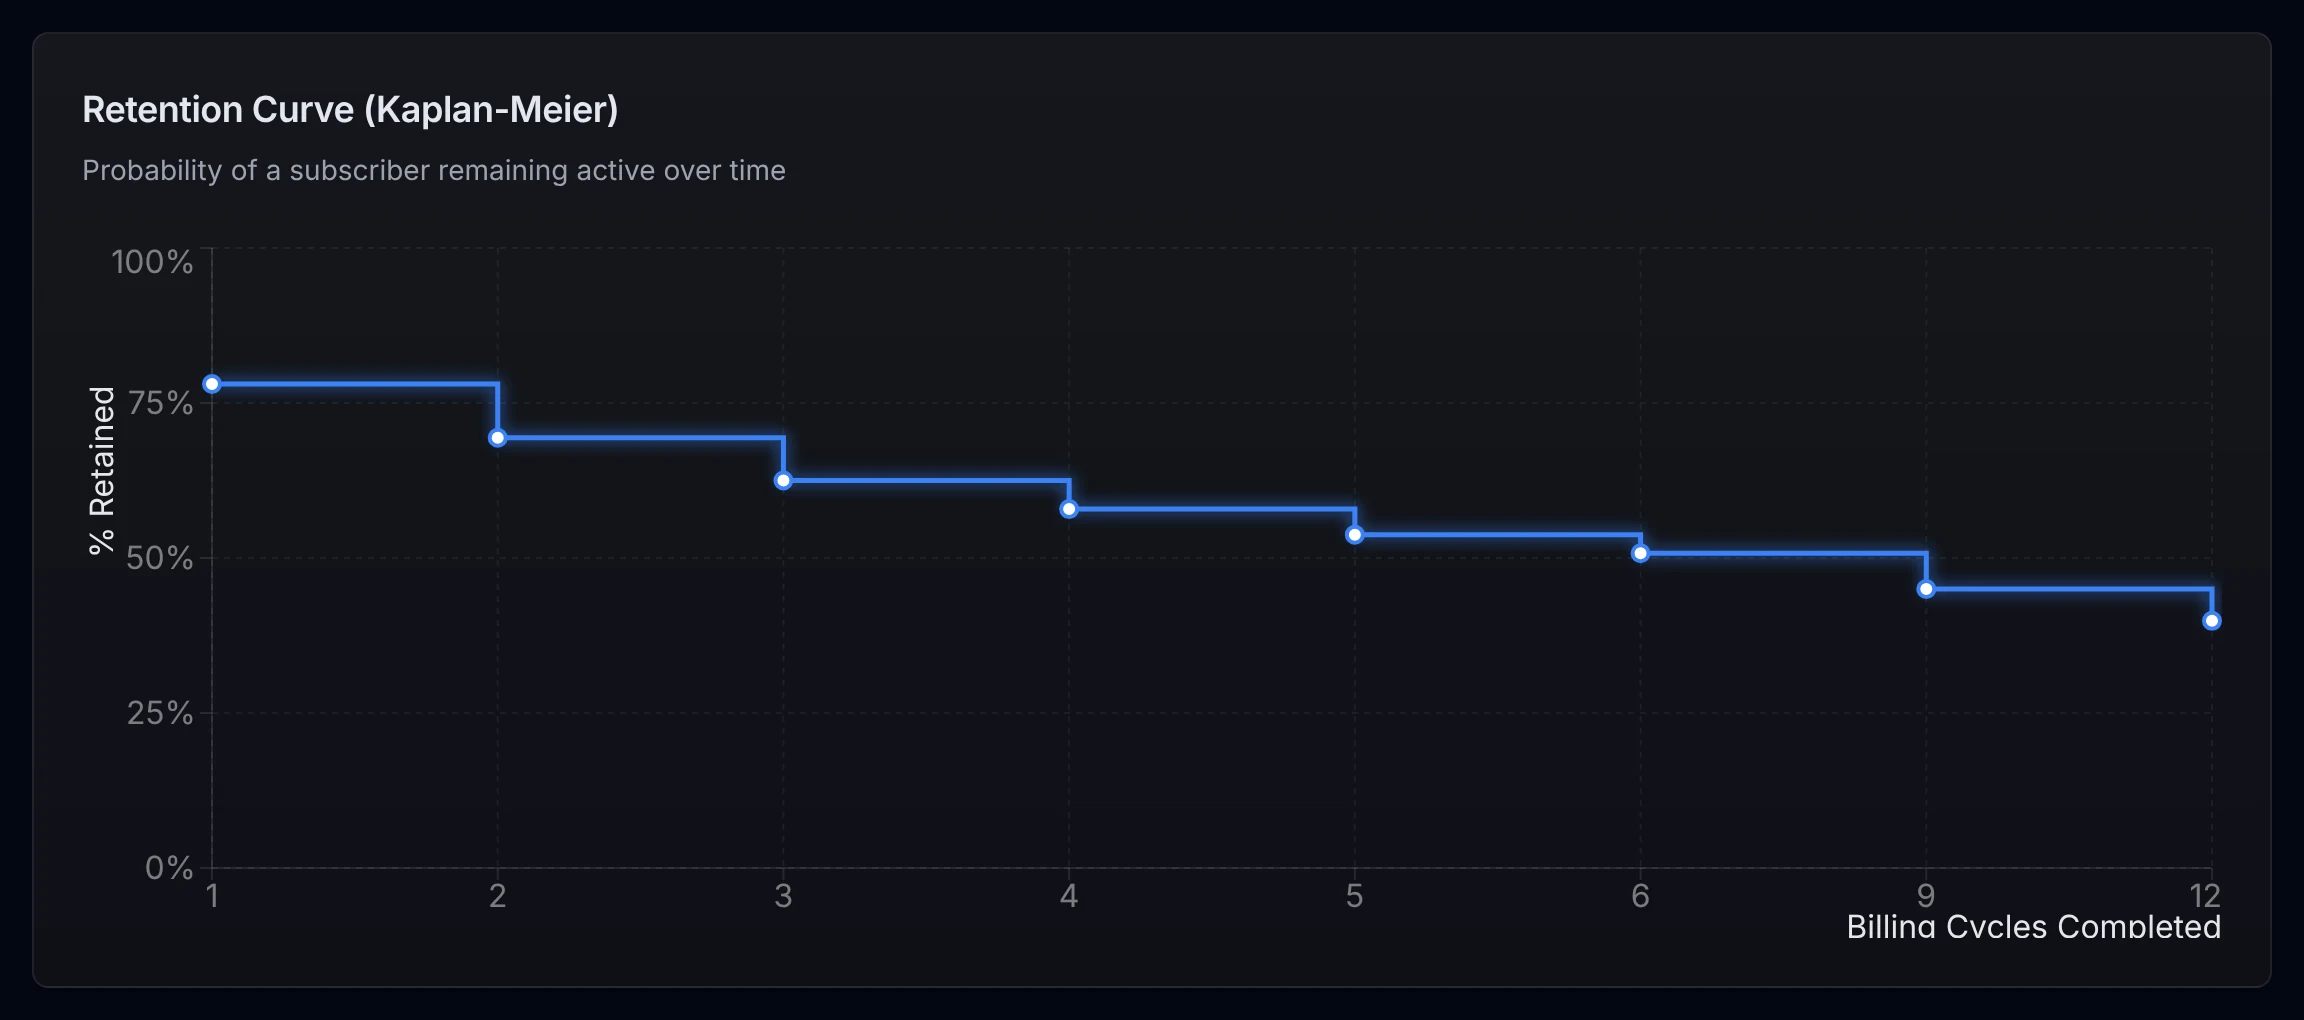
Watch retention cohort by cohort
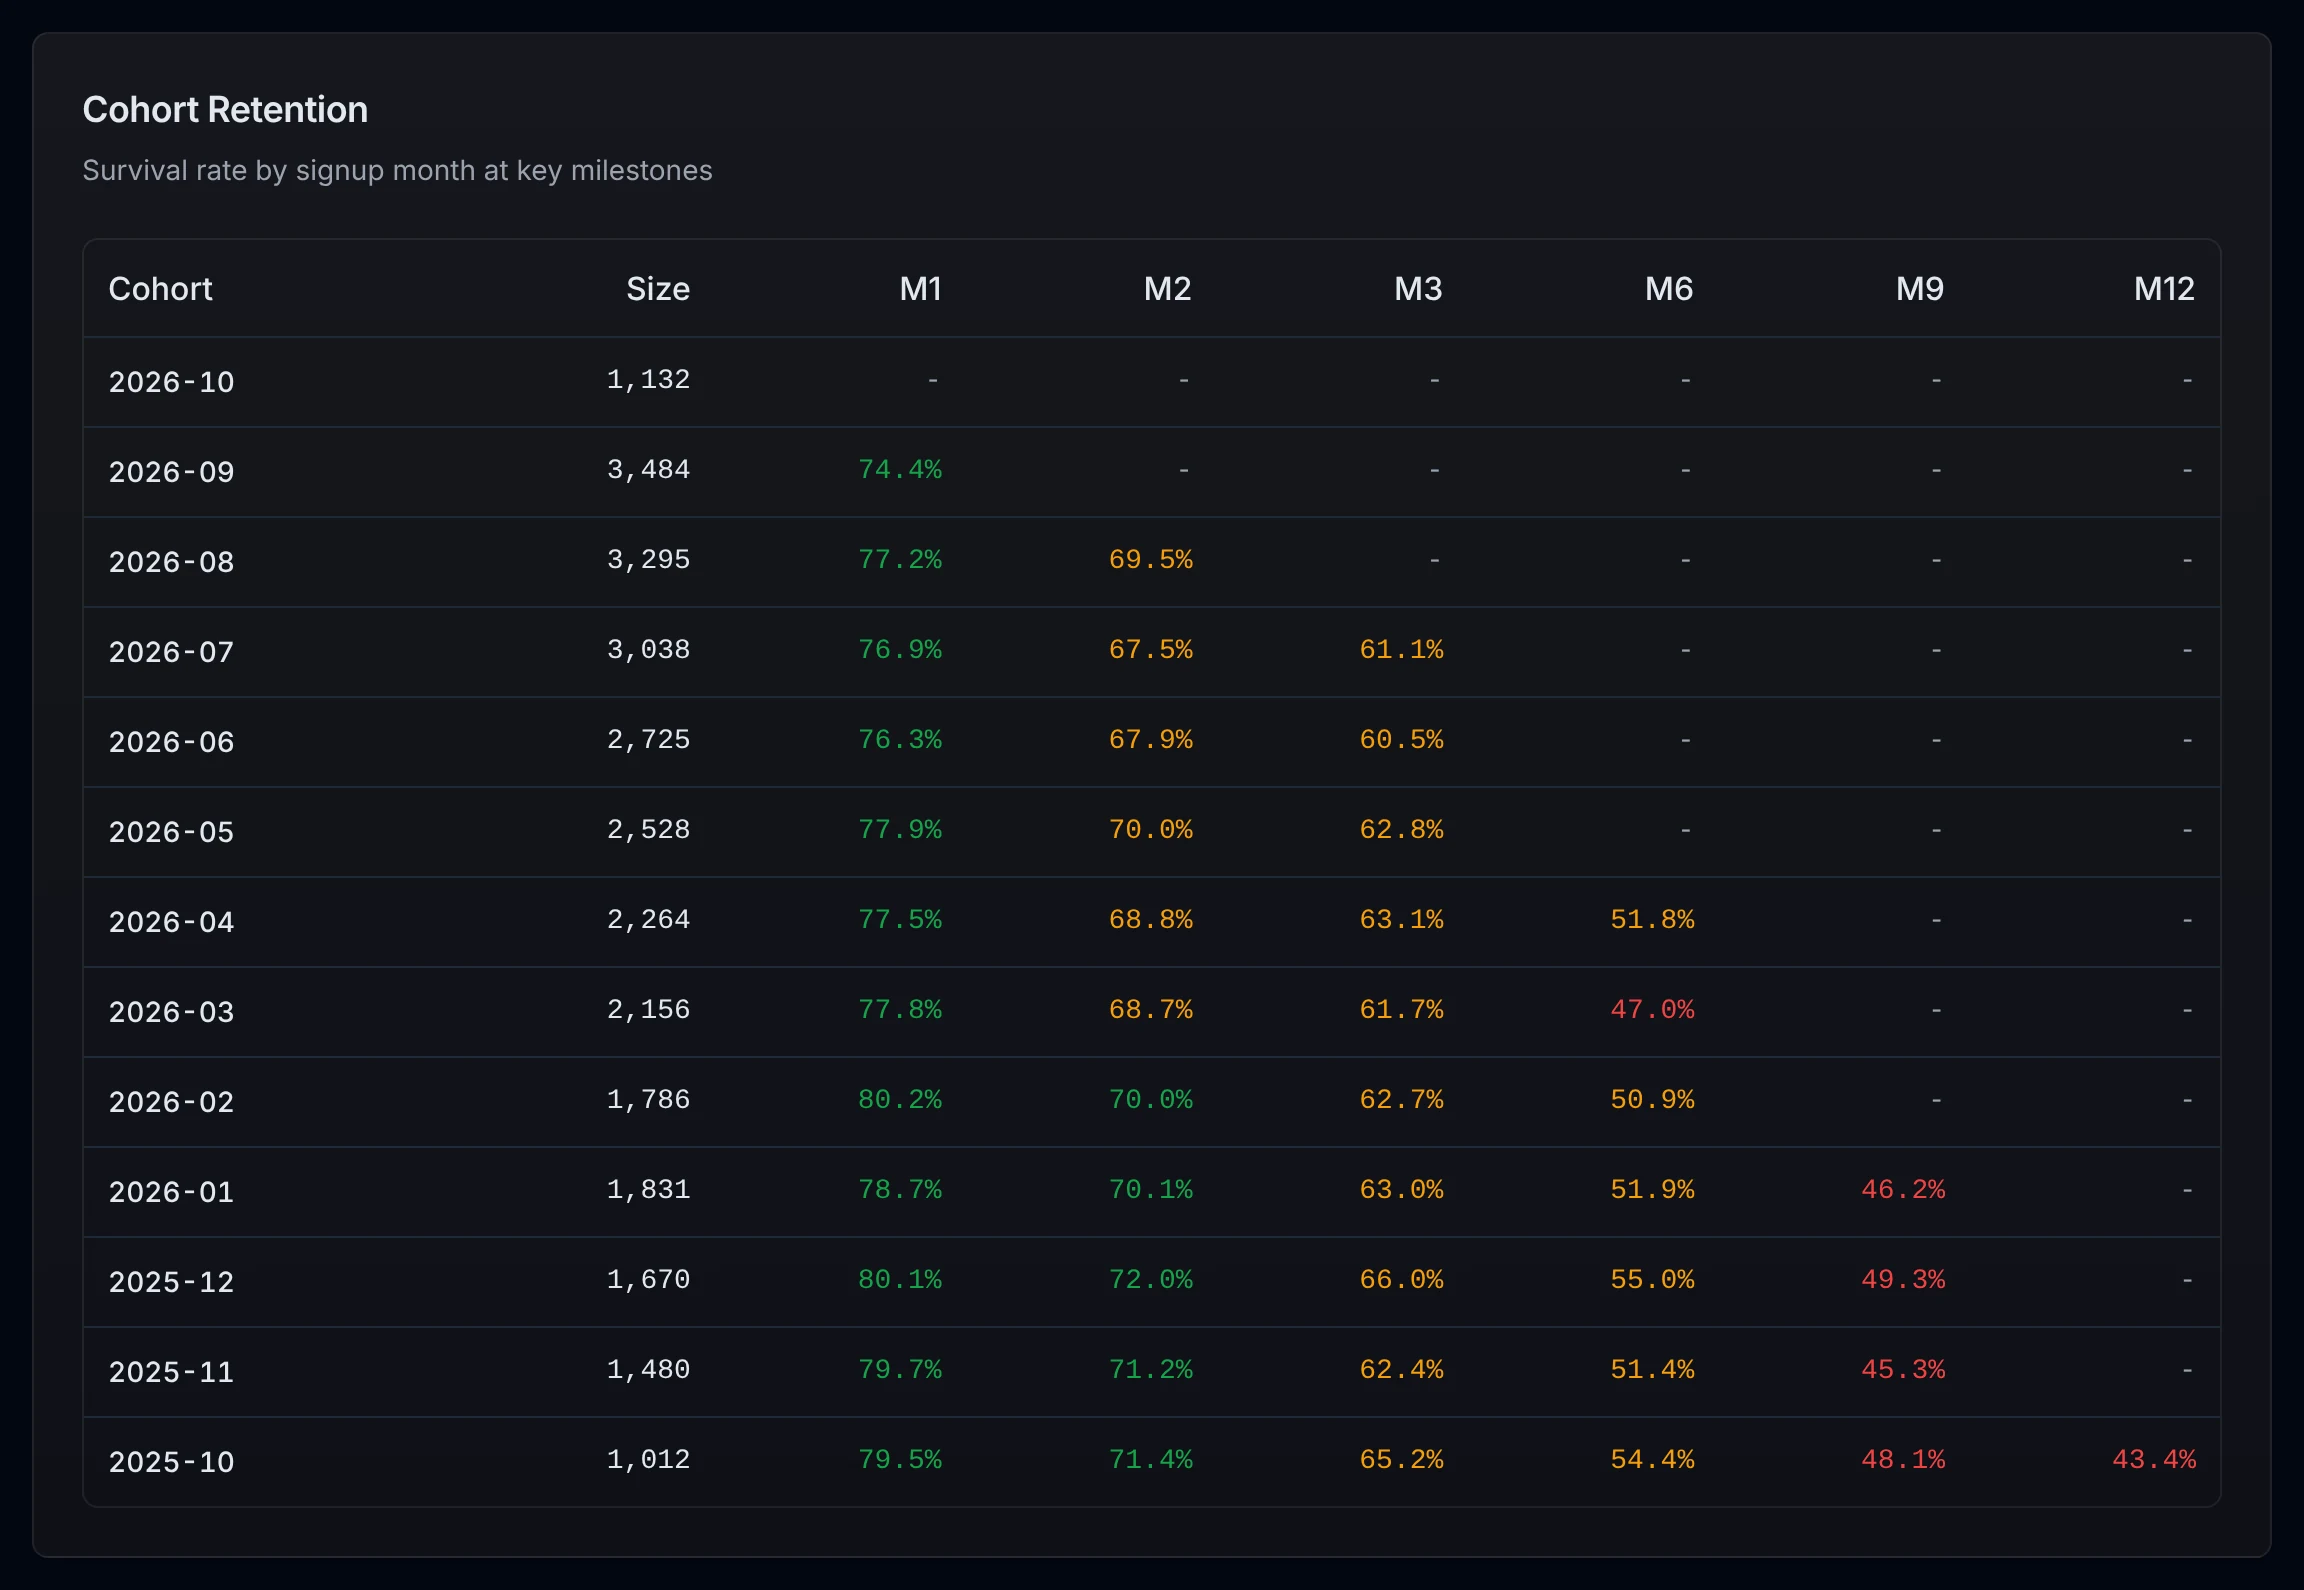
Subscription medicine lives or dies on whether patients stay. Every signup month gets its own retention curve, so you see the moment a cohort starts to slip.
Dashboards for the people running the operation
Pharmacists, clinicians, and ops leads open a dashboard and see where the day is going. A slowing step shows up before it becomes a missed SLA.
Time to fill by stage
Live| Stage | p50 | p95 | Throughput |
|---|---|---|---|
| Intake to review | 8m | 24m | 42/hr |
| Review to compound | 22m | 1h 12m | 38/hr |
| Compound to QA | 35m | 2h 04m | 34/hr |
| QA to ship | 12m | 28m | 36/hr |
Pre-built operational dashboards
Time-to-fill, review queues, fulfillment throughput, clinician performance, and patient flow are ready the day you start, with nothing to build.
Time-to-fill and review analytics
Every step from order received to patient delivery is timed, so you can find the bottleneck, benchmark teams, and track the fix.
Clinician performance
Consult volume, response times, prescribing patterns, and patient outcomes show where to buy back time for your clinical team.
Data quality analysis
Inconsistencies and anomalies across your medical workflows are flagged, so the data behind clinical decisions stays clean.
Audit-ready compliance logs
Every action, change, and access is logged and queryable, and an audit report takes minutes instead of days.
select pharmacy,
percentile(time_to_fill, 0.95) as p95,
count(*) as orders
from orders
where filled_at > '2026-09-01'
group by 1 order by 2 desc
| pharmacy | p95 | orders |
|---|---|---|
| Northwind Rx | 3h 48m | 1,204 |
| Harbor Compounding | 2h 14m | 986 |
| Bluebird Pharmacy | 1h 52m | 742 |
SQL for the people building on it
The data is already structured, timestamped, and queryable across pharmacy, telehealth, and care. Write a query and get your answer in seconds.
Raw SQL access
Query your operational data directly and get answers in seconds, without waiting for engineering to pull a report.
MCP integrations
Connect 5 Axis data to your AI workflows and the tools your team already uses through the Model Context Protocol.
Data warehouse connection
Stream operational data to Snowflake, BigQuery, Redshift, or Databricks and join it with the rest of your business.
Built for everyone who needs the data
The same numbers serve the pharmacy floor, the boardroom, and the data team. Everyone works from one source of truth.
Pharmacy operations leads
Track time-to-fill, review queues, and throughput across the whole operation, and catch bottlenecks before they become SLA breaches.
Brand owners and executives
See patient conversion, retention, revenue, and operational health in one place, and decide with data instead of instinct.
Developers and data teams
Build custom analytics with SQL, warehouse sync, and MCP, feed the data into your models, and automate your reporting.
Clinical leadership
Understand clinician workload, patient outcomes, and prescribing patterns, and give providers back time for care.
See your whole operation clearly
Talk to our team about what Data & Intel looks like for your operation, or email us at [email protected].